Before I ramble on, I have to admit this is some nerdy economic data analysis stuff, but I think you’ll get something out of it, so I’ll try to be brief and get to the point. 👍
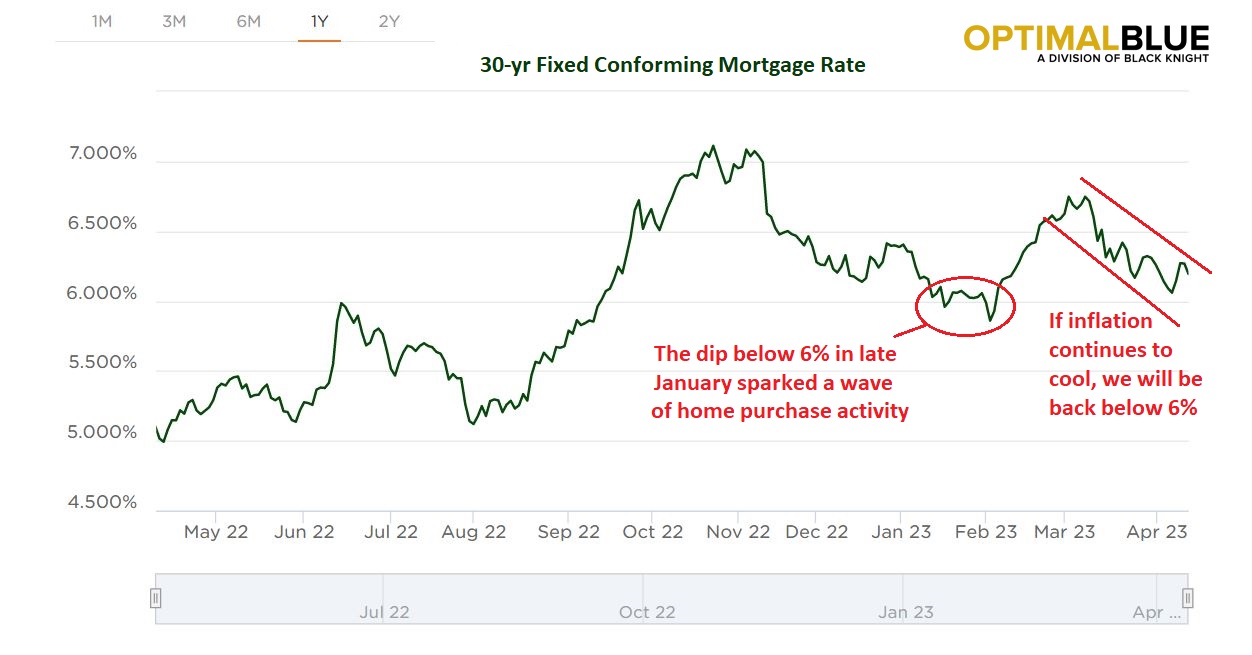
We all know inflation has been a stubbornly persistent issue for consumers for at least a year now. In order to combat a continued inflation rise, the Federal Reserve has hiked interest rates at a precedent-setting pace — +475bps in about 12-months. What does it mean in real life? Well, for one thing, it means mortgage interest rates have over doubled in that same amount of time, making home affordability nearly impossible for A LOT of wanna-be homeowners.
Don’t give up hope….There are some encouraging signs that inflation is finally cooling, but you really have to dig in to see exactly where and how it’s cooling. Stay with me. 😊
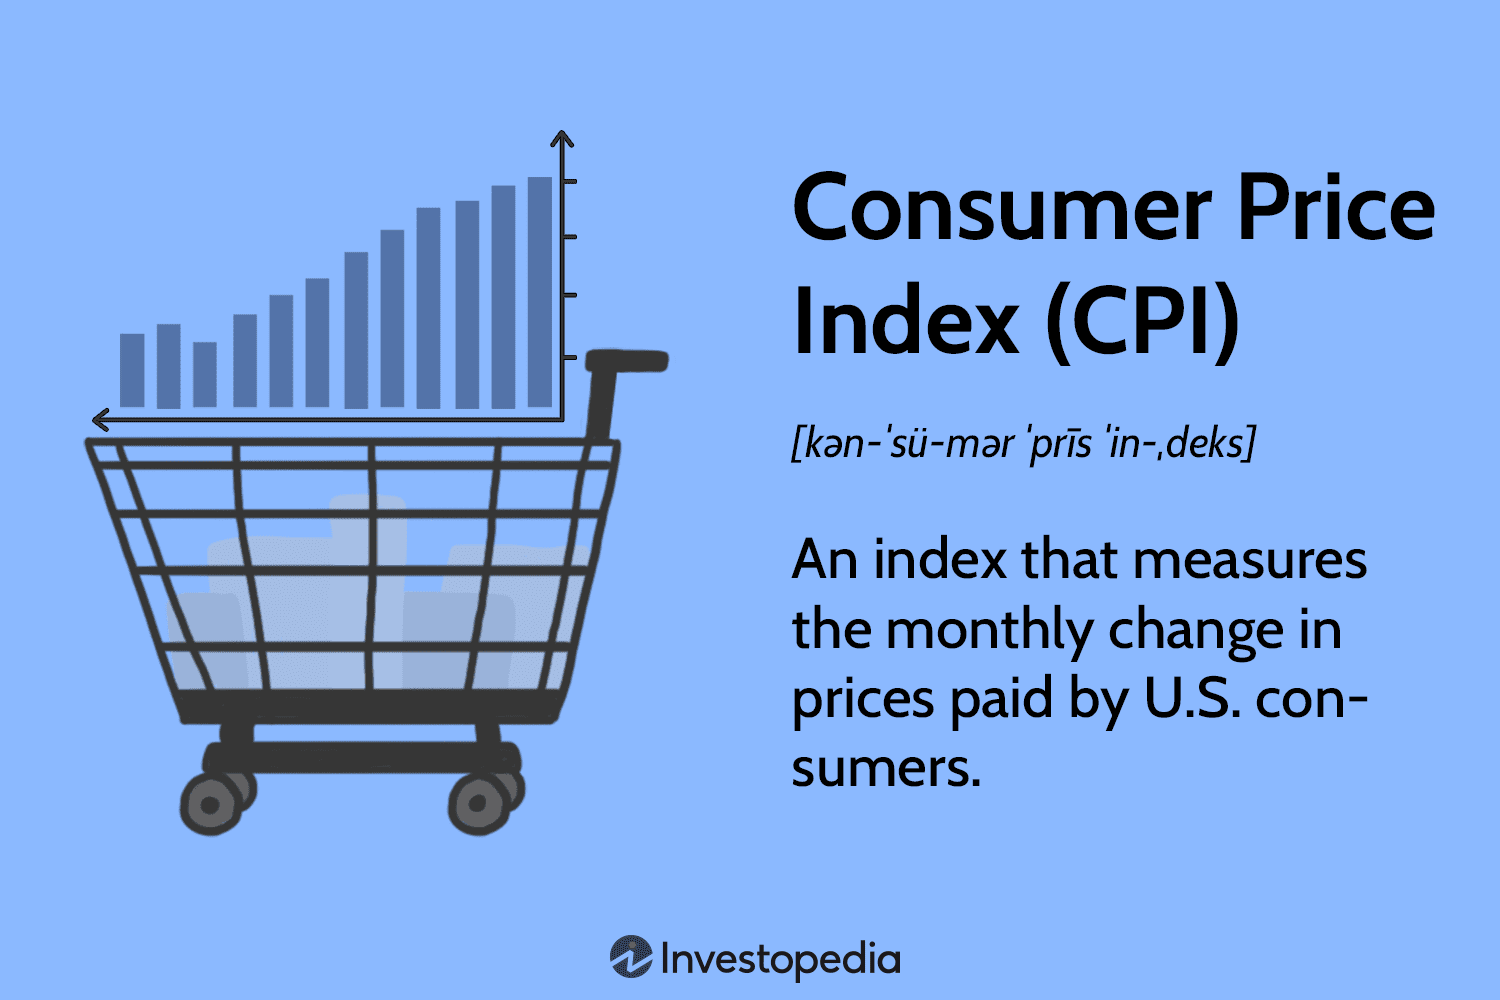
First let’s see what components make up the CPI – Consumer Price Index. This index is one of the key indicators that helps the Federal Reserve decide if/when to raise or lower interest rates. Notice in the chart below, just how heavily weighted HOUSING is:

With a 40% influence on the headline CPI number, housing is extremely important. But there’s a slight problem and it’s called LAG TIME. Sure, we all know the housing market has slowed considerably, but it’s not showing in the CPI data, and as such, it’s not persuading the Federal Reserve to ease back on the rate hike throttle. Not yet, anyway.
Within that Housing component of the CPI, there is a data point called Rent & Rental Equivalence. The Fed has their own way of calculating and updating the data, but there are plenty of more forward-looking indicators that are painting a very interesting picture.
Here’s where I lean on some of my excellent connections at LinkedIn. Shoutout to Emily Peck and Jay Parsons.
Emily points out in her 4/13/2023 Axios article that “more signs are emerging that rent inflation has peaked.” This is important because we need overall CPI to cool in order for interest rates to move lower and for housing to become more affordable for folks looking to finance their home purchase. Nobody likes 7% 30-yr mortgage rates….trust me.
Notice the decline in month-over-month rent prices in 2023.

Now let’s look at a recent LinkedIn post from Jay Parsons – Rental Housing Economist. He points out that rent growth is indeed cooling but has yet to be reflected in the CPI data — there’s that ugly LAG TIME problem again. His analysis of New Lease Asking Rent and CPI Rent show a serious lag effect. Notice how CPI Rent (green) is just starting to turn, but the Effective Asking Rent (orange) peaked almost a year ago and is dropping rapidly.

So what does it all mean? I wholeheartedly agree with my LinkedIn friends and I’m fully expecting continued cooling of broad inflation and a much lower reading in the housing component of the CPI in future reports. This will be good for prospective homebuyers looking for mortgage financing.
As you can see, we are in a clear downtrend in the popular 30-yr mortgage rate. As long as inflation keeps cooling, especially in the heavily weighted housing component, we could see sub-6% again, easily. If you’re in the market for a new home, don’t give up. Conditions will get better. 😊